
DUCK DUCK GOOSE COMMUNICATE
Intelligent Communicating devices are the key to increasing rooftop solar penetration
By Rick Kornfeld
Kitu Systems, Inc
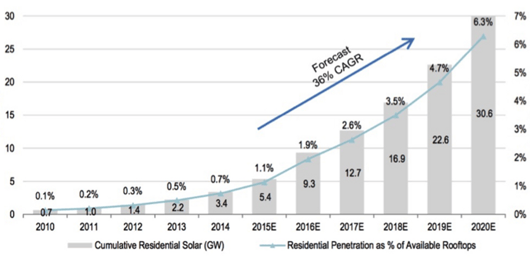
In the United States, a record 1.4 gigawatts (GW) of solar was installed in the second quarter of 2015. This trend is expected to continue at least through 2016 driven by tax incentives (ITC) and attractive solar Power Purchase Agreements (PPAs). In the medium term, growth will continue despite reductions in tax incentives driven by the decreasing cost of solar equipment and installation. Longer term, rooftop solar will additionally benefit from the the EPA’s Clean Power Plan.

Consumers across the country are enjoying the benefits of lowered electricity bills and cleaner air. The good news is that there is plenty of room for growth given that solar has penetrated only about 1% of the available rooftops in the United States. This represents an enormous opportunity for greater penetration of solar, less dependence on fossil fuels and more reliance on clean, sustainable and renewable energy.
But, increasing the penetration of distributed solar generation isn’t as simple as decreasing costs and increasing incentives. The electric grid wasn’t designed for distributed generation, and as the penetration of rooftop solar increases, so does the possibility of grid instability. There are various classifications for this potential grid instability, but a set of the most troublesome problems are grouped together and euphemistically called the “duck curve” problem.
There’s been a lot of talk lately about the duck curve. What is the duck curve, why does it matter, and what can we do about it?
What's the problem?
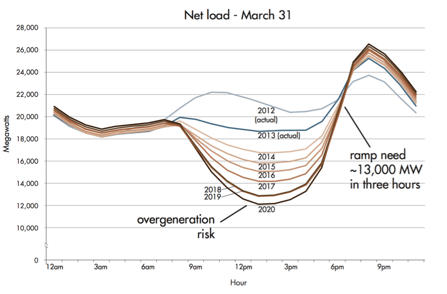
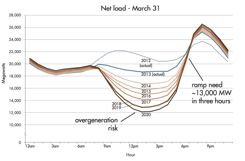
The best way to understand the duck curve is to look at a couple of examples. The figures below show the net load in California on January 11 and March 31. The net load is shown today and projected through the year 2020.
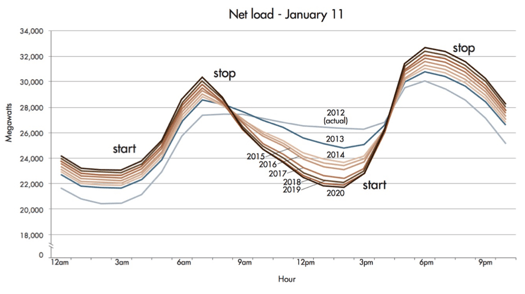
Starting with the duck’s “tail”, at the beginning of the day the sun is rising and consumers are waking up and using electricity. In the winter, this requires that the utility ramp generation. While in the spring, solar generation and consumer load are increasing about equally resulting in a roughly flat duck tail.
At midday, the situation is very different. Both in the winter and in spring, the net load drops forming the “belly” of the duck. In spring, the belly can be very deep and can risk cutting into the utility base load creating an over-generation instability.
As the day ends and the sun sets, the net load increases rapidly forming the neck of the duck. This rapid increase occurs in every season although the intensity of the increase varies. As a side note, in Hawaii, this increase is so rapid that the duck curve is known as the “Nessie curve” after the Loch Ness Monster’s long neck. Managing the duck’s neck requires utilities to bring on generation resources at a rapid rate – projected in California to be as much as 13 GW over 3 hours.
It’s important to note that the issues described here in the “tail”, “belly” and “neck” of the duck can lead to grid instability and to black-outs. And it’s also important to note that these issues vary considerably as a function of the day of the year, weather, feeder network topology, etc.
The bottom line is that increasing the penetration of distributed solar generation can lead to black-outs and that the associated problems are complex and dynamic.
What's the solution?
As with most complex problems, there are multiple approaches to increasing the penetration of distributed solar generation. We’ll talk about a few of these approaches, but as will become clear, these solutions require intelligent devices communicating with each other and/or with the cloud.
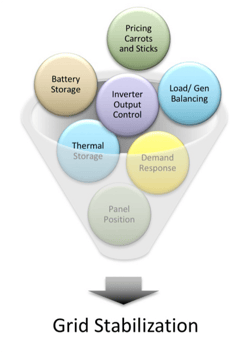
The solutions fall into a few categories:
DUCK DUCK GOOSE COMMUNICATE
Intelligent Communicating devices are the key to increasing rooftop solar penetration
By Rick Kornfeld
Kitu Systems, Inc
In the United States, a record 1.4 gigawatts (GW) of solar was installed in the second quarter of 2015. This trend is expected to continue at least through 2016 driven by tax incentives (ITC) and attractive solar Power Purchase Agreements (PPAs). In the medium term, growth will continue despite reductions in tax incentives driven by the decreasing cost of solar equipment and installation. Longer term, rooftop solar will additionally benefit from the the EPA’s Clean Power Plan.
Consumers across the country are enjoying the benefits of lowered electricity bills and cleaner air. The good news is that there is plenty of room for growth given that solar has penetrated only about 1% of the available rooftops in the United States. This represents an enormous opportunity for greater penetration of solar, less dependence on fossil fuels and more reliance on clean, sustainable and renewable energy.
But, increasing the penetration of distributed solar generation isn’t as simple as decreasing costs and increasing incentives. The electric grid wasn’t designed for distributed generation, and as the penetration of rooftop solar increases, so does the possibility of grid instability. There are various classifications for this potential grid instability, but a set of the most troublesome problems are grouped together and euphemistically called the “duck curve” problem.
There’s been a lot of talk lately about the duck curve. What is the duck curve, why does it matter, and what can we do about it?
What's the problem?
The best way to understand the duck curve is to look at a couple of examples. The figures below show the net load in California on January 11 and March 31. The net load is shown today and projected through the year 2020.

Starting with the duck’s “tail”, at the beginning of the day the sun is rising and consumers are waking up and using electricity. In the winter, this requires that the utility ramp generation. While in the spring, solar generation and consumer load are increasing about equally resulting in a roughly flat duck tail.
At midday, the situation is very different. Both in the winter and in spring, the net load drops forming the “belly” of the duck. In spring, the belly can be very deep and can risk cutting into the utility base load creating an over-generation instability.
As the day ends and the sun sets, the net load increases rapidly forming the neck of the duck. This rapid increase occurs in every season although the intensity of the increase varies. As a side note, in Hawaii, this increase is so rapid that the duck curve is known as the “Nessie curve” after the Loch Ness Monster’s long neck. Managing the duck’s neck requires utilities to bring on generation resources at a rapid rate – projected in California to be as much as 13 GW over 3 hours.
It’s important to note that the issues described here in the “tail”, “belly” and “neck” of the duck can lead to grid instability and to black-outs. And it’s also important to note that these issues vary considerably as a function of the day of the year, weather, feeder network topology, etc.
The bottom line is that increasing the penetration of distributed solar generation can lead to black-outs and that the associated problems are complex and dynamic.
What's the solution?
As with most complex problems, there are multiple approaches to increasing the penetration of distributed solar generation. We’ll talk about a few of these approaches, but as will become clear, these solutions require intelligent devices communicating with each other and/or with the cloud.
The solutions fall into a few categories:
The solutions above are not mutually exclusive. Increasing the penetration of distributed solar generation will require a mix and match of many of these solutions.
Inverter Output Control
Before delving into the topic of inverter output control, it’s worth briefly defining the function of an inverter in a solar generation system. The inverter is used to convert the DC voltage from the solar panel(s) to an AC voltage appropriate for a direct connection to the grid. This means the correct output voltage, power, and in some cases, the phase offset between the output voltage and current.
This phase offset determines the reactive power output and is also known as VAr. Intelligently varying VAr improves the efficiency of the power delivered, which is particularly useful during the duck’s neck.
Inverters monitor grid voltage and frequency, and in normal operation, synchronize their output accordingly.
Smart inverters also monitor the grid but unlike previous versions of inverters, smart inverters autonomously modify their output based on a set of stored curves. This functionality, as described in California’s proposed rule 21, allows smart inverters to store a set of curves downloaded from the utility or service provider and apply these curves based on a downloaded schedule. These Distributed Energy Resource (DER) curves allow the smart inverter to (for example) lower its output power if the grid frequency increases, or change the output reactance based on changes in grid voltage.
The Electric Power Research Institute (EPRI) has reported that the hosting capacity of solar can be doubled using curves that allow the modification of output reactance (VAr) as a function of grid voltage (V).
The default communication protocol from the utility/service provider to the smart inverter is called Smart Energy Protocol 2.0 (SEP2.0) which is an international standard also known as IEEE 2030.5. Products using this standard are available today and provide secure, reliable, scalable and standards-based communication.
Panel Position
Changing the positioning of a solar panel is effectively equivalent to a static change in the inverter’s output. Facing panels westward can shift/delay solar output generation by as much as an hour, but at the expense of annual energy generation. This may have an incrementally positive impact on grid stability; although in some scenarios, this can simply delay and not necessarily mitigate the impact of the duck’s neck.
The weakest attribute of pointing panels westward is that this alone is not responsive to the specific and dynamic conditions of the grid. Therefore, variations due to season, weather, feeder topology, etc. can’t be taken into account. Methods such as this are not based on coordinated feedback and therefore have limited efficacy.
Curtailing Demand - Pricing Carrots and Sticks & Demand Response
Curtailing demand involves reducing, and in some cases shifting loads. Note that shifting loads resembles storage discussed in the next section.
Looking at the duck curve again, curtailing demand to mitigate the impact of distributed solar generation is most effective in the evening around the duck’s neck thereby reducing the generation ramp.
There are multiple methods to curtail load including a utility or service provider directly controlling loads (e.g. Demand Response, Flow Reservation), creating pricing schemes that incentivize consumers to reduce (e.g. Real Time Pricing, Peak Time Rebate), pricing that punishes consumers that do not reduce (e.g. Real Time Pricing, Critical Peak Pricing), consumer awareness programs, etc.
Consumers are not opposed to load curtailment as long as their lifestyle is not negatively (or only minimally) impacted and they are incentivized to participate. Not impacting consumers’ lifestyle requires that curtailment systems are easy to configure and use, work autonomously without consumer interaction, and meet or exceed their needs. Meeting consumers’ needs means that (for example) the temperature is within an acceptable range, their electric vehicle is charged when needed, the pool pumps enough water to keep it clean, and so forth.
The intelligence behind a curtailment system is called an Energy Management System or EMS. In most situations, the functionality of the EMS is distributed among the end device (for example a thermostat), a local EMS, and a cloud EMS.
Communication within the home or business involves a variety of consumer devices and necessitates the use open, interoperable, secure, scalable communication protocols most prominently SEP2.0 (IEEE 2030.5). There are similar requirements for communication from the home/business to the utility or service provider. Here, in addition to SEP2.0, OpenADR2.0b is an appropriate communication standard.
Storage - Battery Storage & Thermal Storage
Storing and retrieving energy is a multifaceted topic, even when narrowed to storing energy to increase grid stability in the context of distributed solar generation.
In all cases, storing energy provides a means to flatten the duck curve. The specific methods used depend on the specifics of how, when and the form of storage, and how, when and the form of retrieval. Some examples are:
Battery
-
Store energy during times of potential over-generation, e.g. the duck’s belly
-
Retrieve energy to smooth the ramp to bring on utility generation, e.g. the duck’s neck
Water heater
-
Increase the temperature of stored water in household water heater in advance (duck’s belly)
-
Reduce load during during evening utility generation ramp (duck’s neck)
Air Conditioning
-
Pre-cool during times of excess energy generation (duck’s belly)
-
Reduce load during utility generation ramp (duck’s neck)
Of course, there are other examples, such as storing and retrieving energy in an Electric Vehicle’s battery or using stored thermal energy to generate electricity. But what all of these examples have in common is that maintaining and/or improving consumer experience, optimizing incentives, and maximizing the efficacy of grid stabilization requires communication and coordination among intelligent devices.
Coordinating the storage and retrieval of energy can be managed locally by edge computing in the home or business, in the cloud centrally, or in most cases, a hybrid of the two. Whatever the approach, it is important that the communication protocols used be secure, scalable, and based on international standards. This includes protocols such as OpenADR2.0b for bulk load management and SEP2.0 (IEEE 2030.5) for individual device management and grid-connected storage device management.
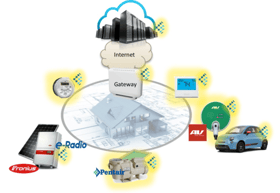
Load/Generation Balancing
Bringing many of the methods above together involves a local EMS and cloud EMS operating to balance loads and generation in a manner similar to micro-grids and nano-grids. Kitu Systems demonstrated such a system at the SEP2 Expo in June 2015 at the Electric Power Research Institute. (https://www.epri.com/)

Systems such as this, and the associated EMS innovations are made possible because devices use an international, interoperable, secure and scalable communication protocol. In the example above, the communication protocol used was SEP2.0 (IEEE2030.5).
Conclusion
Distributed solar generation is growing at a rapid rate. The penetration of available rooftops in the United States is relatively low, creating an opportunity for a dramatic increase in clean, sustainable and renewable energy generation.
But, increasing the penetration of distributed solar can lead to grid instabilities, often characterized as the “duck curve” problem. The duck curve problem is complex and dynamic.
Solving dynamic problems requires dynamic solutions. This necessitates the use of intelligent devices communicating with each other and with the cloud.
Communication protocols must be open, based on international standards, secure and scalable. Smart Energy 2.0 (SEP2.0) also known as IEEE2030.5 is such a standard.
The solutions above are not mutually exclusive. Increasing the penetration of distributed solar generation will require a mix and match of many of these solutions.

Inverter Output Control
Before delving into the topic of inverter output control, it’s worth briefly defining the function of an inverter in a solar generation system. The inverter is used to convert the DC voltage from the solar panel(s) to an AC voltage appropriate for a direct connection to the grid. This means the correct output voltage, power, and in some cases, the phase offset between the output voltage and current.
This phase offset determines the reactive power output and is also known as VAr. Intelligently varying VAr improves the efficiency of the power delivered, which is particularly useful during the duck’s neck.
Inverters monitor grid voltage and frequency, and in normal operation, synchronize their output accordingly.
Smart inverters also monitor the grid but unlike previous versions of inverters, smart inverters autonomously modify their output based on a set of stored curves. This functionality, as described in California’s proposed rule 21, allows smart inverters to store a set of curves downloaded from the utility or service provider and apply these curves based on a downloaded schedule. These Distributed Energy Resource (DER) curves allow the smart inverter to (for example) lower its output power if the grid frequency increases, or change the output reactance based on changes in grid voltage.
The Electric Power Research Institute (EPRI) has reported that the hosting capacity of solar can be doubled using curves that allow the modification of output reactance (VAr) as a function of grid voltage (V).
The default communication protocol from the utility/service provider to the smart inverter is called Smart Energy Protocol 2.0 (SEP2.0) which is an international standard also known as IEEE 2030.5. Products using this standard are available today and provide secure, reliable, scalable and standards-based communication.
Panel Position
Changing the positioning of a solar panel is effectively equivalent to a static change in the inverter’s output. Facing panels westward can shift/delay solar output generation by as much as an hour, but at the expense of annual energy generation. This may have an incrementally positive impact on grid stability; although in some scenarios, this can simply delay and not necessarily mitigate the impact of the duck’s neck.
The weakest attribute of pointing panels westward is that this alone is not responsive to the specific and dynamic conditions of the grid. Therefore, variations due to season, weather, feeder topology, etc. can’t be taken into account. Methods such as this are not based on coordinated feedback and therefore have limited efficacy.
Curtailing Demand - Pricing Carrots and Sticks & Demand Response
Curtailing demand involves reducing, and in some cases shifting loads. Note that shifting loads resembles storage discussed in the next section.
Looking at the duck curve again, curtailing demand to mitigate the impact of distributed solar generation is most effective in the evening around the duck’s neck thereby reducing the generation ramp.
There are multiple methods to curtail load including a utility or service provider directly controlling loads (e.g. Demand Response, Flow Reservation), creating pricing schemes that incentivize consumers to reduce (e.g. Real Time Pricing, Peak Time Rebate), pricing that punishes consumers that do not reduce (e.g. Real Time Pricing, Critical Peak Pricing), consumer awareness programs, etc.
Consumers are not opposed to load curtailment as long as their lifestyle is not negatively (or only minimally) impacted and they are incentivized to participate. Not impacting consumers’ lifestyle requires that curtailment systems are easy to configure and use, work autonomously without consumer interaction, and meet or exceed their needs. Meeting consumers’ needs means that (for example) the temperature is within an acceptable range, their electric vehicle is charged when needed, the pool pumps enough water to keep it clean, and so forth.
The intelligence behind a curtailment system is called an Energy Management System or EMS. In most situations, the functionality of the EMS is distributed among the end device (for example a thermostat), a local EMS, and a cloud EMS.
Communication within the home or business involves a variety of consumer devices and necessitates the use open, interoperable, secure, scalable communication protocols most prominently SEP2.0 (IEEE 2030.5). There are similar requirements for communication from the home/business to the utility or service provider. Here, in addition to SEP2.0, OpenADR2.0b is an appropriate communication standard.
Storage - Battery Storage & Thermal Storage
Storing and retrieving energy is a multifaceted topic, even when narrowed to storing energy to increase grid stability in the context of distributed solar generation.
In all cases, storing energy provides a means to flatten the duck curve. The specific methods used depend on the specifics of how, when and the form of storage, and how, when and the form of retrieval. Some examples are:
Battery
-
Store energy during times of potential over-generation, e.g. the duck’s belly
-
Retrieve energy to smooth the ramp to bring on utility generation, e.g. the duck’s neck
Water heater
-
Increase the temperature of stored water in household water heater in advance (duck’s belly)
-
Reduce load during during evening utility generation ramp (duck’s neck)
Air Conditioning
-
Pre-cool during times of excess energy generation (duck’s belly)
-
Reduce load during utility generation ramp (duck’s neck)
Of course, there are other examples, such as storing and retrieving energy in an Electric Vehicle’s battery or using stored thermal energy to generate electricity. But what all of these examples have in common is that maintaining and/or improving consumer experience, optimizing incentives, and maximizing the efficacy of grid stabilization requires communication and coordination among intelligent devices.
Coordinating the storage and retrieval of energy can be managed locally by edge computing in the home or business, in the cloud centrally, or in most cases, a hybrid of the two. Whatever the approach, it is important that the communication protocols used be secure, scalable, and based on international standards. This includes protocols such as OpenADR2.0b for bulk load management and SEP2.0 (IEEE 2030.5) for individual device management and grid-connected storage device management.
Load/Generation Balancing
Bringing many of the methods above together involves a local EMS and cloud EMS operating to balance loads and generation in a manner similar to micro-grids and nano-grids. Kitu Systems demonstrated such a system at the SEP2 Expo in June 2015 at the Electric Power Research Institute. (https://www.epri.com/)
Systems such as this, and the associated EMS innovations are made possible because devices use an international, interoperable, secure and scalable communication protocol. In the example above, the communication protocol used was SEP2.0 (IEEE2030.5).
Conclusion
Distributed solar generation is growing at a rapid rate. The penetration of available rooftops in the United States is relatively low, creating an opportunity for a dramatic increase in clean, sustainable and renewable energy generation.
But, increasing the penetration of distributed solar can lead to grid instabilities, often characterized as the “duck curve” problem. The duck curve problem is complex and dynamic.
Solving dynamic problems requires dynamic solutions. This necessitates the use of intelligent devices communicating with each other and with the cloud.
Communication protocols must be open, based on international standards, secure and scalable. Smart Energy 2.0 (SEP2.0) also known as IEEE2030.5 is such a standard.